Collaborate with

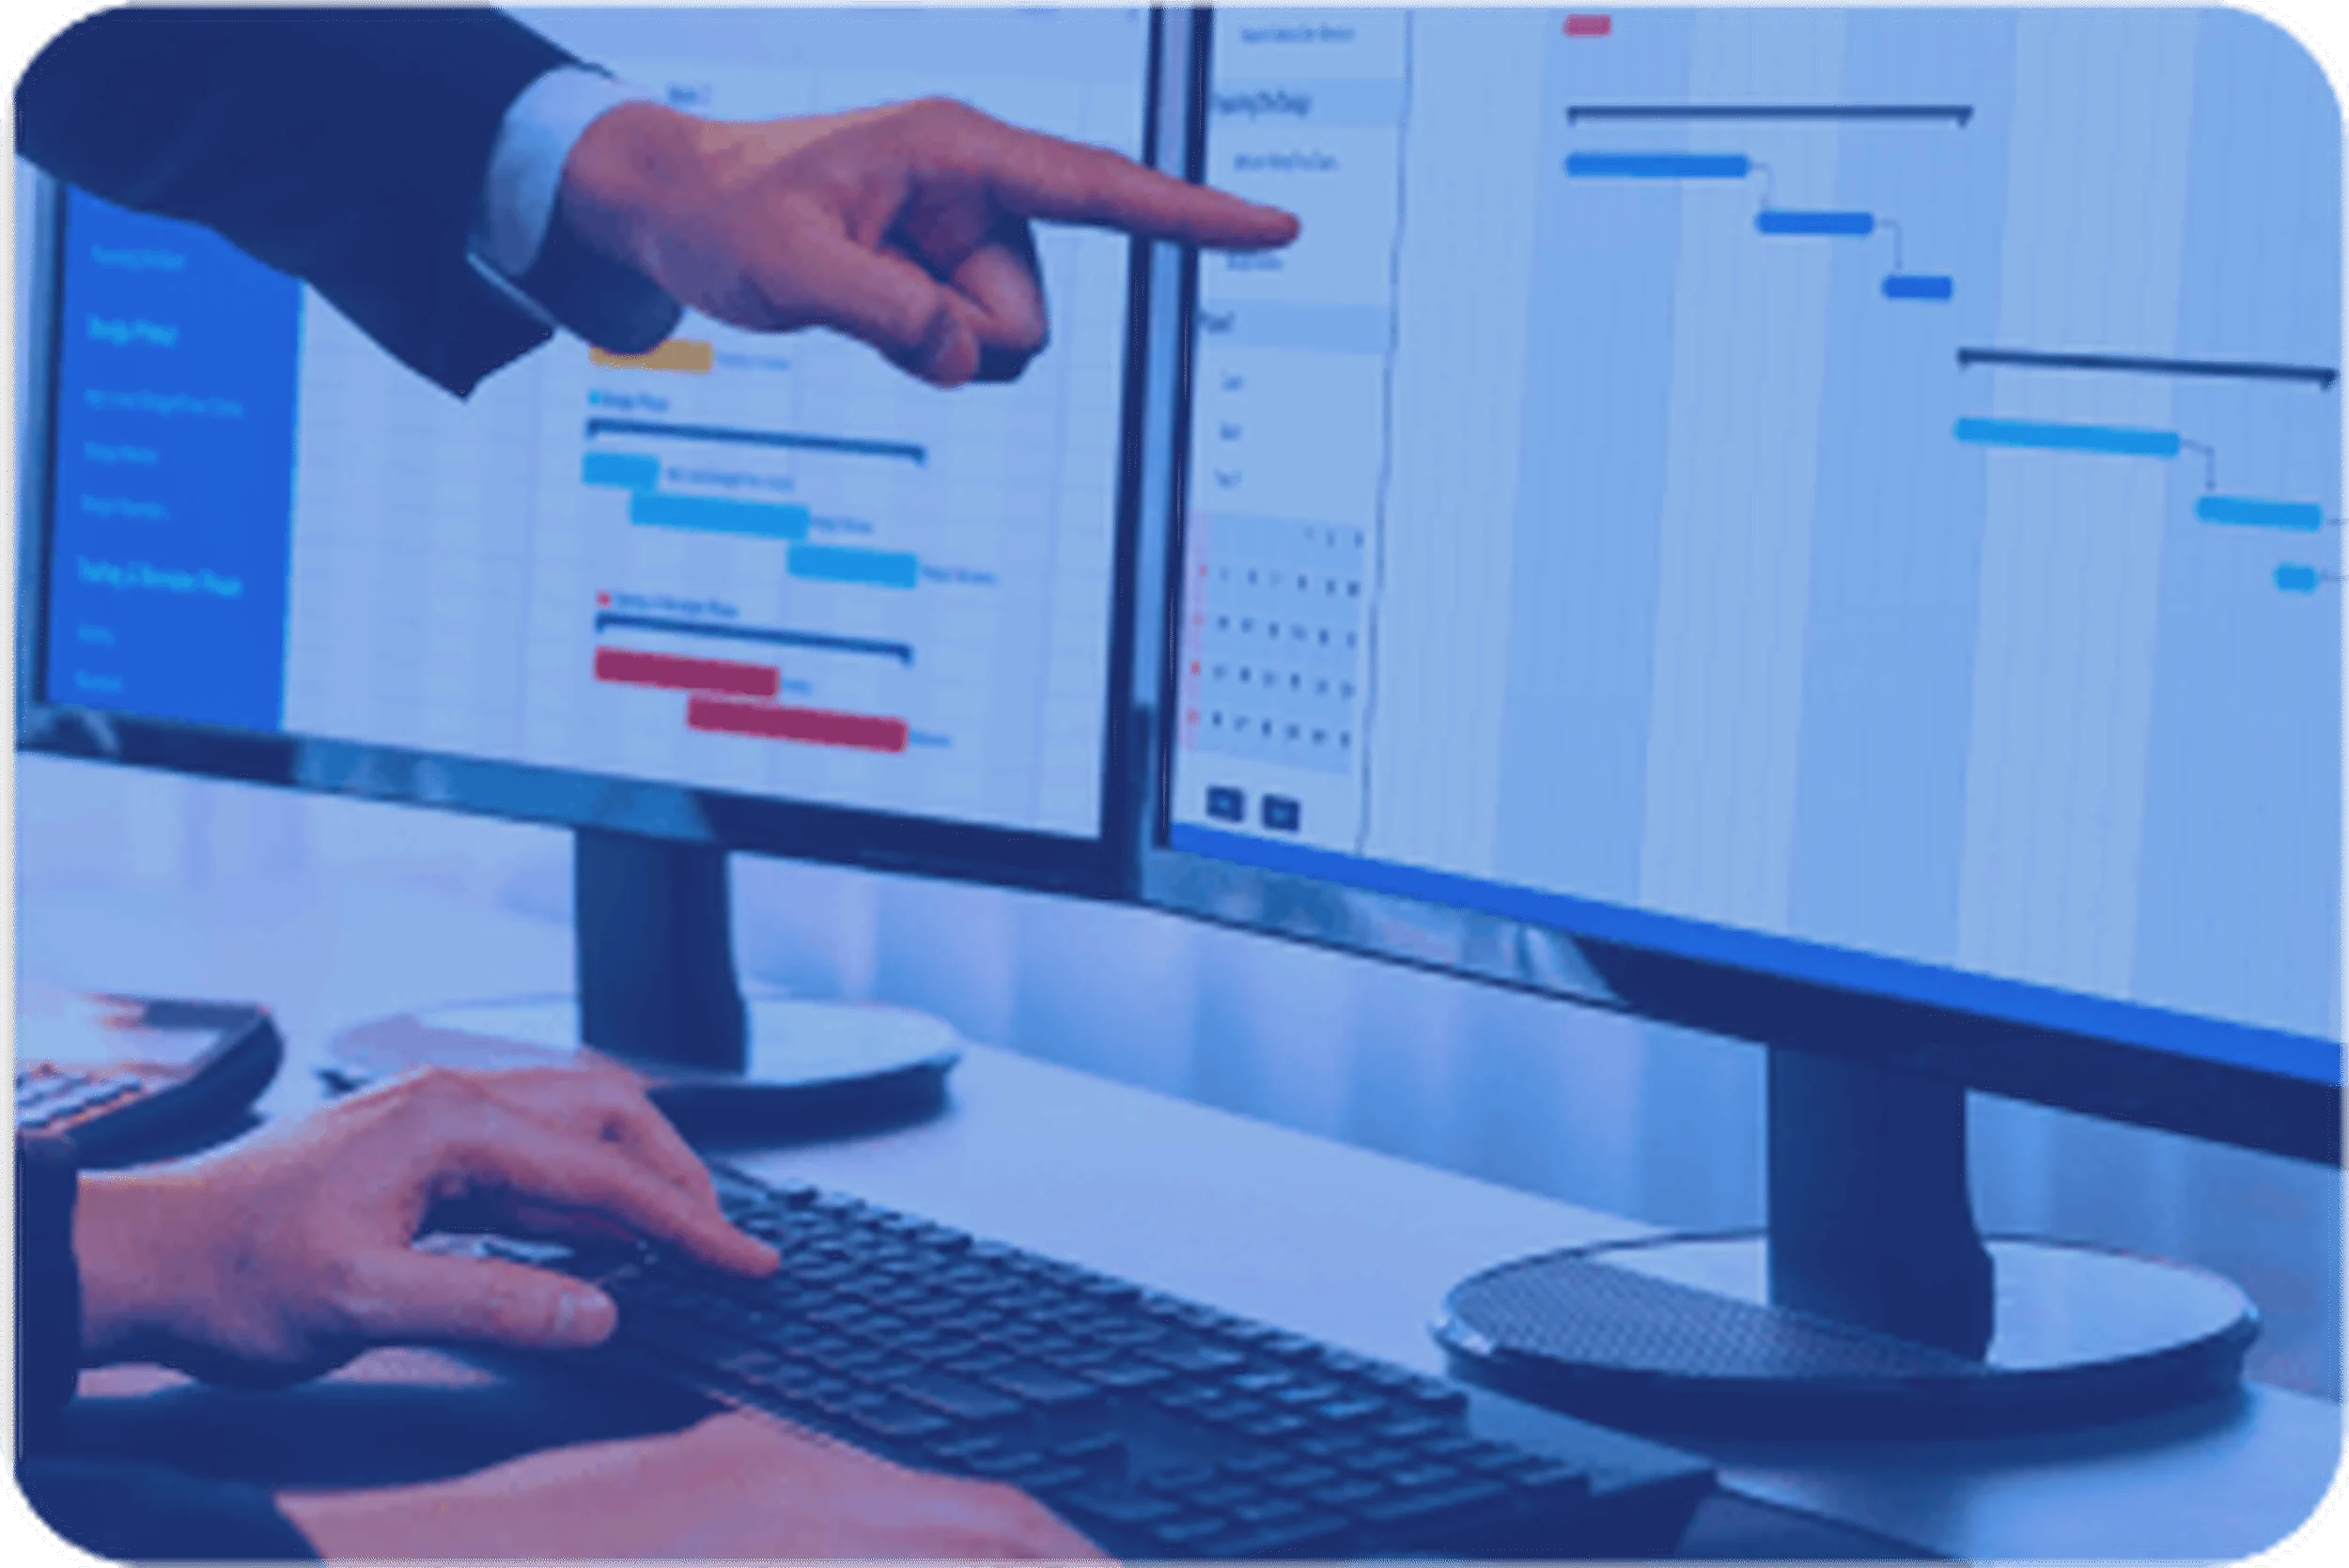
Reporting & Visualization

Benefits of Reporting and Visualization

BI Program Management
Unleash your true potential with proactive leadership, elevating your projects, programs, and portfolios to new heights.
Reports, Extracts, & Data Submissions
Elevate your decision-making with our custom reports, dashboards, and data extracts. We specialize in transforming raw data into actionable insights from EMRs like Epic, Cerner, Meditech, and more, while also integrating external data such as health claims, operational data, and social determinants of health (SDOH).

Visualization & Dashboards
Take your data analysis to the next level with our cutting-edge visualization and dashboard solutions, elevating insights to new heights.

Enterprise Reporting as a Service (ERaaS)
Eliminate backlogs and enhance your reporting team’s capabilities with our best-practice-driven Enterprise Reporting as a Service (ERaaS) solution.

Advanced Analytics
Gain meaningful insights, enhance decision-making, and drive improvement with our Advanced Analytics. By combining descriptive and prescriptive analytics with machine learning, NLP, and robotic process automation, we forecast health trends, optimize patient care, and transform data into strategic assets, improving clinical outcomes.
Our Approach
At 314e, we employ a sophisticated and comprehensive approach to reporting and visualization.
This tailored approach allows us to deliver personalized reporting, visualization, dashboarding, business intelligence, and analytics solutions that provide actionable insights to drive informed business decisions.
The Proof Behind Our Promises

We Delivered Real-Time Insights for COVID-19 Management
Our Advanced Analytics Dashboard Enhances Health System Response
Discover how we implemented a cutting-edge COVID-19 and vaccine administration dashboard using the Azure Synapse Analytics platform, enabling real-time data integration and insights to support critical healthcare operations.
Read the full success storyFrequently Asked Questions
Healthcare professionals use several data visualization tools to analyze and display data effectively. Common tools include:
- Tableau: Renowned for its interactive dashboards and ability to handle extensive datasets.
- Data Integration Tools: Software that collects and organizes data from different sources.
- Microsoft Power BI: Provides powerful analytics and visualization features with seamless integration into Microsoft services.
- QlikView/Qlik Sense: Offers robust data discovery and visualization capabilities.
- Domo: Focuses on real-time data insights and business intelligence.
- Looker: Enables detailed data exploration and customizable dashboards."
Healthcare dashboards offer several advantages, including:
- Immediate Access: They provide current data, allowing healthcare providers to monitor patient information and operational metrics instantly.
- Enhanced Decision-making: By aggregating data from various sources, dashboards support quicker and more informed decision-making.
- Streamlined Data Interpretation: Dashboards present key metrics and trends visually, simplifying data analysis.
- Increased Efficiency: They reduce the need for manual data processing by consolidating information into a single view.
- Improved Patient Care: Dashboards help track performance indicators and patient outcomes, facilitating continuous improvement in care quality."